Interdigitation and Interpolation Methods for Continuous Position Input
Home
This page accompanies our TEI 2019 paper on pressure sensor matrix design. Here we provide a basic overview of our results with additional figures that did not fit the paper. Data and code can be found in our GitHub repository.
We have – in the past – build various pressure sensor matrices, such as this one, published at NIME 2017 and also Open Source. We had various discussions on how to optimize the design, and finally decided to simply test things rather than making decisions based on assumptions.
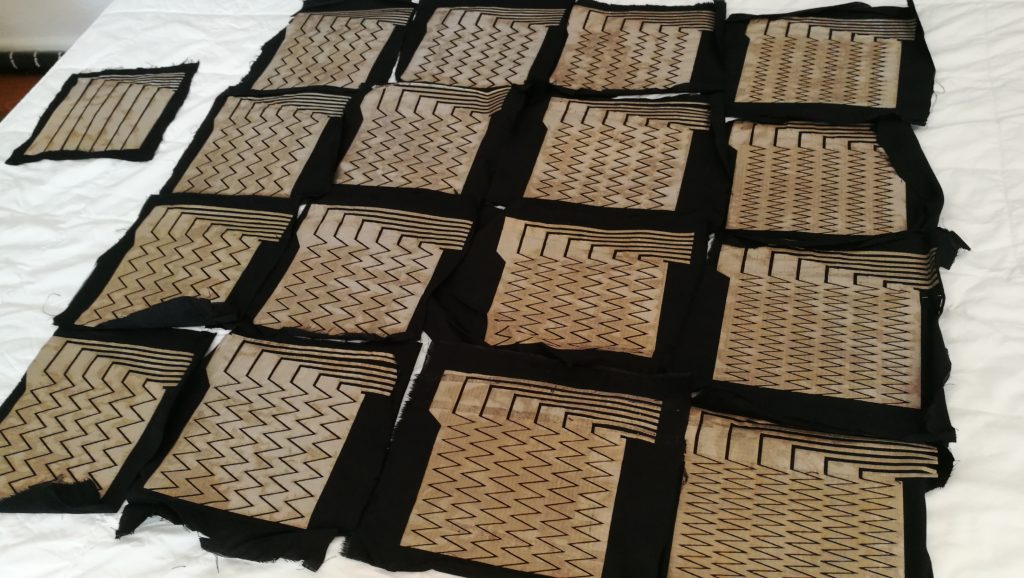
To do so we built 17 different sensors, and tested their accuracy using 3 different touch sizes and 8 different touch-detection algorithms.
This page is intended to provide an overview of the results and link to all relevant material for reproducing the analysis and designing interdigitated sensors.
You can find an excel file that can help in selecting parameters for your own sensor here.
Please refer to our paper for the full details. Keep scrolling for an overview of the results.
Touch Characteristics
In general, touch characteristics are what we have the least control over. We can’t very well tell users to change the size of their fingers and generally we don’t control how much pressure they use. Still, we can take their behavior into consideration and we can design sensors to suit the way we expect the users to engage with them.
Pressure
Does it make any difference how hard a user presses the sensor? What are the effects of changing pressure? To answer these questions, we sampled both gentle (the smallest signal we could consistently produce) and strong (taking advantage of the full dynamic range of the sensor) touches.
Precision / Accuracy
We found that on average that low pressure performed better than high pressure over all sensors for accuracy. However, the low pressure condition also had low precision. Strong pressure typically was less accurate, but more precise.
As in: on average low pressure performed better than high pressure, but the readings of the high pressure condition have less variability.
Both figures show the response behavior of a single electrode. The x-axis is the touch position, the y-axis is the measured signal. The top figure shows high pressure. Note that at 30mm and at 105mm the values jump radically – essentially the electrode either measures low or high. The bottom graph shows low pressure readings at the same electrode. The curve is much more gradual, but the values show much higher varience (yellow shows 95% confidence interval, red line is the average over 11 trials, gray lines each indicate a trial)
Consistency (as a function of method)
The difference between high and low pressure was especially strong for the CUBIC peak-detection method. The difference between sensor behavior for high and low pressure was lowest with GAUSSIAN, followed closely by LINEAR, mTOUCH, and COM.
As in: You should probably not use CUBIC peak-detection, while GAUSSIAN might be a good choice if you care mostly about precision and repeatability of measures.
Touch Size
Should electrodes be spaced at intervals smaller than the touch size? Should electrode spacing and touch size be the same? Or maybe touch size should be smaller than electrode size? In practice, the touch size cannot easily change (the size of a fingertip will not change much for a given user). However, we might estimate the expected touch size and then design the sensor accordingly. To investigate how touch/digit width ratios influence the sensing, we used touch-points 50%, 100% and 150% the size of the electrodes (which is the same as the electrode spacing).
In general, we found, large touches perform better than smaller touches. However, this patter was not true for all sensors. For example, for the non-interdigitated sensor, small touches performed better than large touches.
Information Content in Signal
To understand why this is the case, we analyzed how much the signal changes when the position changes. The reasoning for this is that, if there is a measurable change between two positions, there should be a way to determine if the touch is at position 1 or 2. If there is no change between two positions, even the smartest algorithm cannot identify where the sensor is being touched.
The plot below shows the normalized magnitude of the change in signal between adjacent positions. X axis is the position, Y axis magnitude of change. Colors indicate different electrodes. Top row is smallest touch, bottom row is largest touch.
(please note that the sizes are provided in mm, not percent – the legend is incorrect)
What we found is that, for the small touch size the changes in signal were evenly distributed. However, as the touch size increased, there are areas (between 20mm and 50mm as well as between 70mm and 100mm) where there is almost no change in signal and, consequently, it is reasonable that the estimation of touch position is error-prone in those regions.
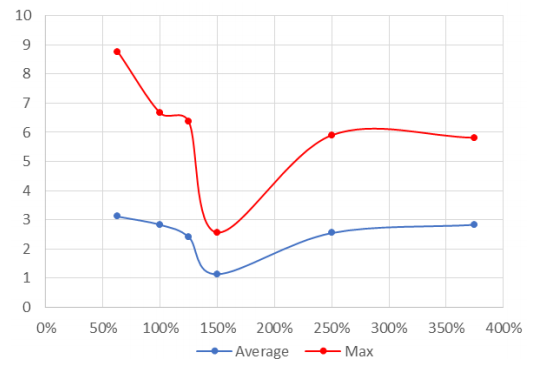
While our initial interest was establishing if touch size should be equal to, smaller, or larger than the electrode size, this suggests that the problem is more complex and that there is a periodic interaction between the size of the elctrode and of the touch. In retrospect it would have been valuable to have a wider range of touch sizes, as we did in our previous (more limited) study on touch accuracy of pressure sensor matrices. That work suggests that further increasing touch-sizes need not result in better accuracy of the tracked position:
Figure taken from our NIME paper. The sensor+algorithm combination tested in that paper, had a its best results at 150% touch size, and increasing or decreasing the touch size increased the average error.
Information
Interaction with Algorithms
Interdigitation Parameters
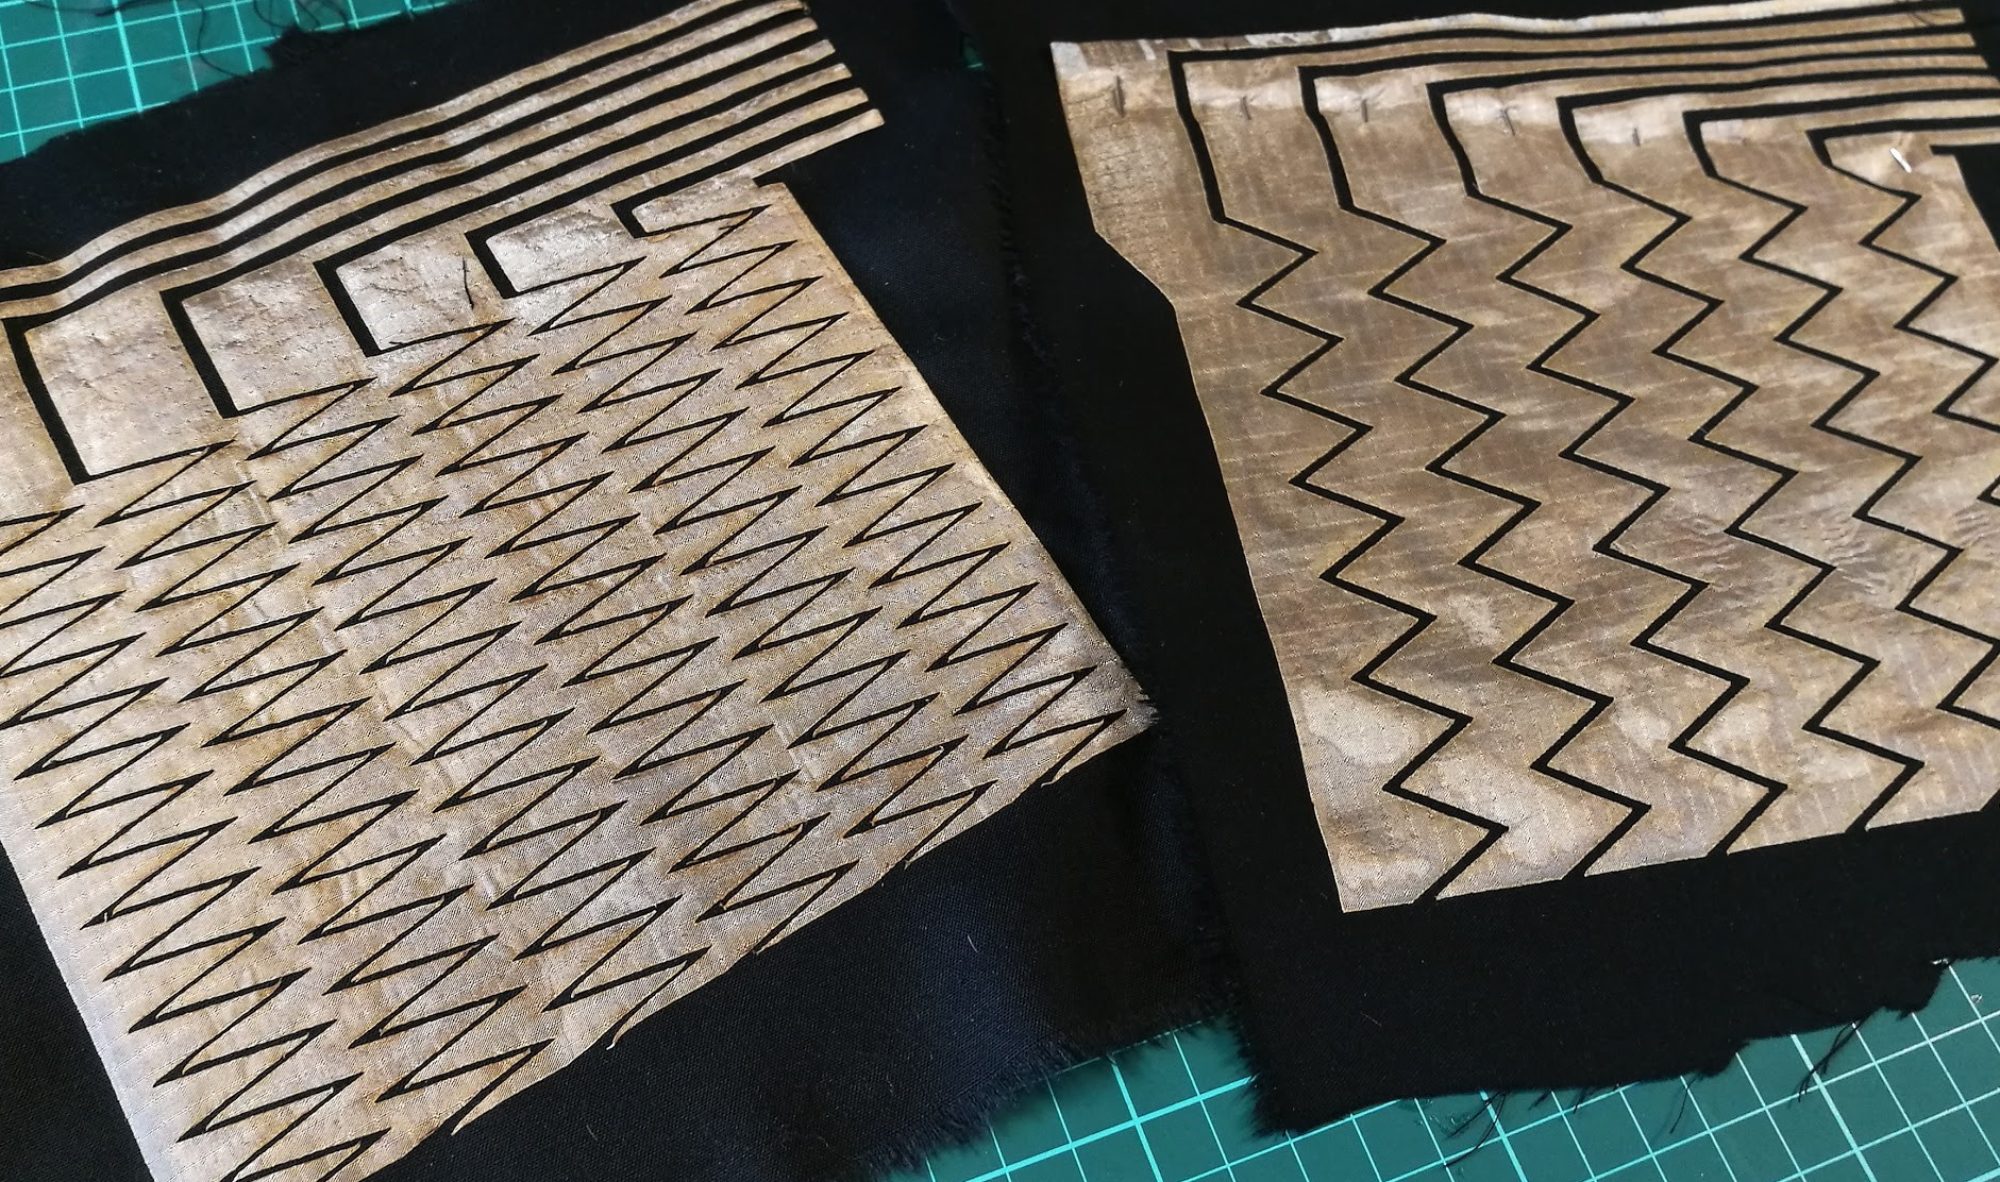
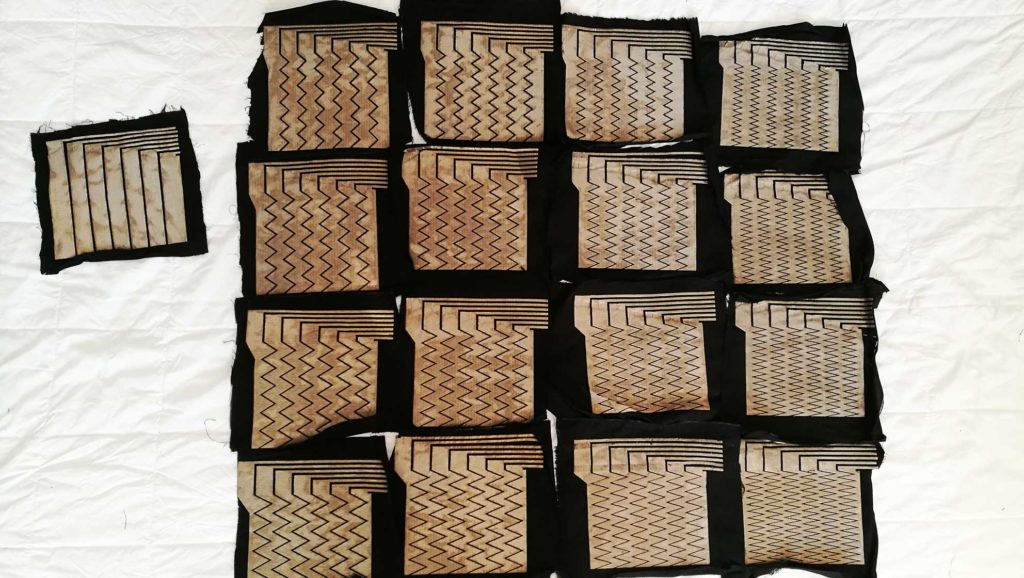
We wrote a Processing Sketch for parametrically generating interdigitated patterns. We decided that the parameters most interesting to us were digit width and digit length (as seen in the large image above).
Though many more parameters could be manipulated, feel free to test our pattern generator.
Digit Length
As we showed in our discussion of the touch-sizes, there is a periodic interaction between touch-size and strip width. Increasing the length of the digits changes the effective strip width and effects these patterns. In the 5 graphs below, we plot the change in sensor readings between each consecutive position (normalized on a scale of 0 to 1). We see that when using 150% touch size (375mm) there are large gaps with hardly any change in signal for the non-interdigitated sensor (top). As we add increasingly longer digits, the change becomes more consistent until, at 100% digit length, the change is almost constant.
We did not find a main effect for this, as the effect of digit length interacts with the touch size – in other words, on average, digit length did not make a difference, however, for the large size, increasing digit length improved the accuracy of the readings.
Digit Width
Digit Width had a strong effect on the results: the narrower the digit, the higher the accuracy and precision. The effect on accuracy is relatively small, while the effect on precision is very large. The larger the touch size, the stronger the benefit of small digit widths.
Below we show the comparison between sensors of a fixed digit length and varying digit width. The thinner the digits, the less variability can be found in the results.
On average, sensors with a digit width < 55% produce results with higher accuracy then non-interdigitated sensors. The precision of the interdigitated sensors is – on average – worse then for a non-interdigitated sensor, however, the trend suggests that, if the digits are thing enough, the precision of the non-interdigitated sensor can eventually be matched.
The figures above show the effects on Precision (left) and on Accuracy (right)
Touch Detection Algorithms
Center of Mass
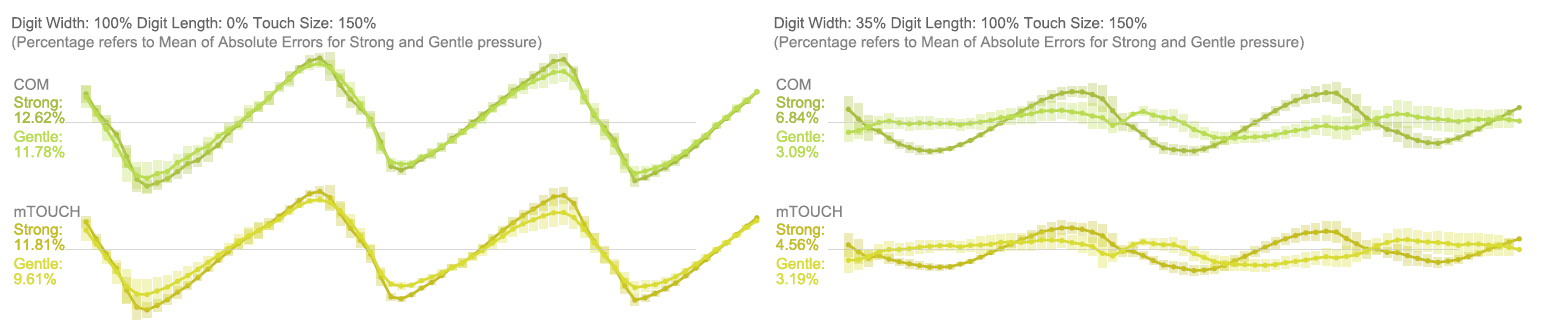
Overall Centre of Mass based approaches led to the best results, especially when using interdigitated electrodes. We used two different approaches mTOUCH calculates the touch position from the three highest values. COM uses the values of all seven electrodes.
Generally mTOUCH led to the best results, once the data had the noise-floor removed and the dynamic range mapped from 0 to 1. Anecdotally, Calculating Centre of Mass using all electrodes led to better results on the more noisy raw data.
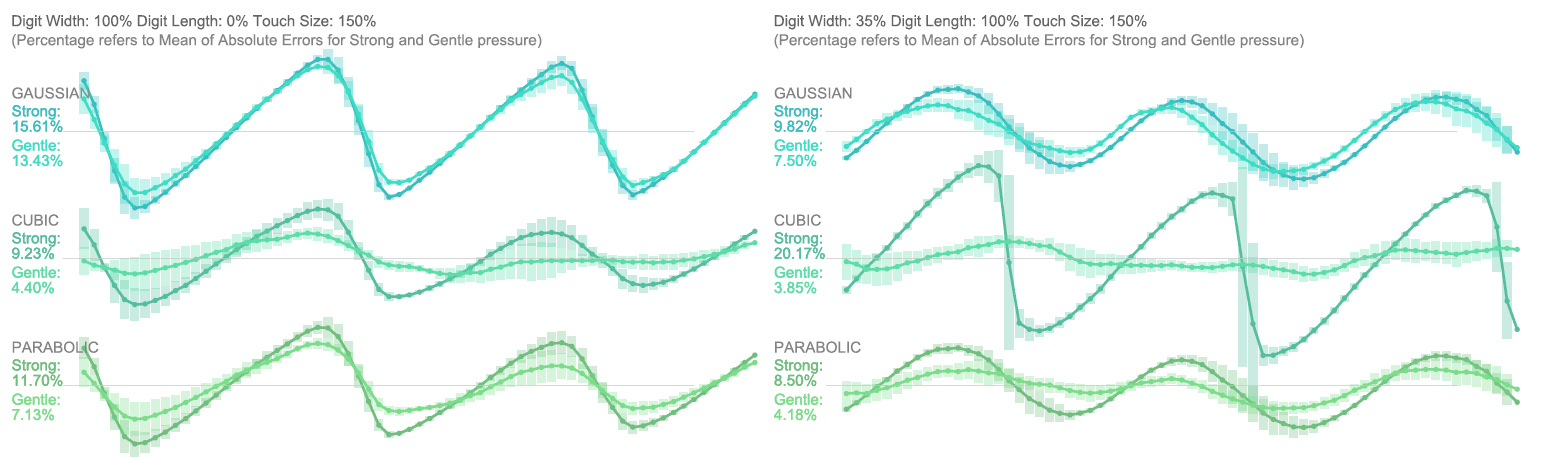
Curve Fitting
Curve Fitting methods assume that the distribution of the pressure values matches a known curve. We tested GAUSSIAN, CUBIC and PARABOLIC curves. We found that CUBIC peak-detection performed surprisingly poorly, especially for interdigitated sensors. While it performed well for low pressure levels, high pressure with CUBIC peak detection lead to some of the worst results we found.
While Centre of Mass approaches generally outperformed Curve Fitting approaches, GAUSSIAN peak-detection performed surprisingly well with regards to consistency over pressure levels and precision.
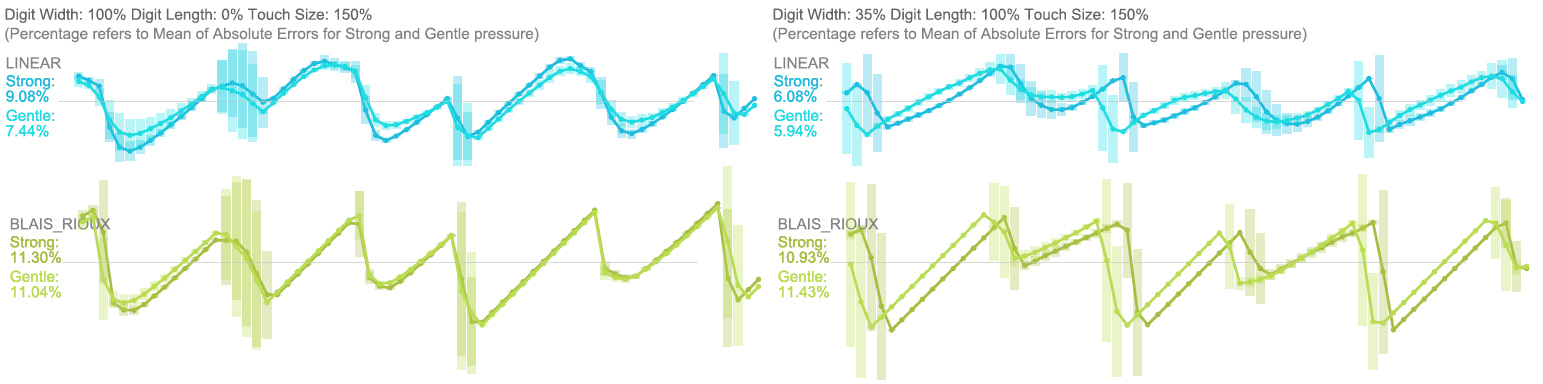
Linear Fitting
Linear Fitting follows the same logic as Curve Fitting, just that we assume that the signal has a linear propagation from its peak. Interestingly the periodic error patterns we found for these peak-detection methods had double the frequency as the others.
In general LINEAR performed well, however, the distribution of errors is slightly non-intuitive, and we speculate that a more consistent method, such as GAUSSIAN Curve Fitting might be more pleasant to users, even though the accuracy is lower. The BLAIS_RIOUX algorithm is originally designed for detecting peaks in streaming real-time data. We modified a modified version by https://link.springer.com/chapter/10.1007/978-1-4471-1921-0_28
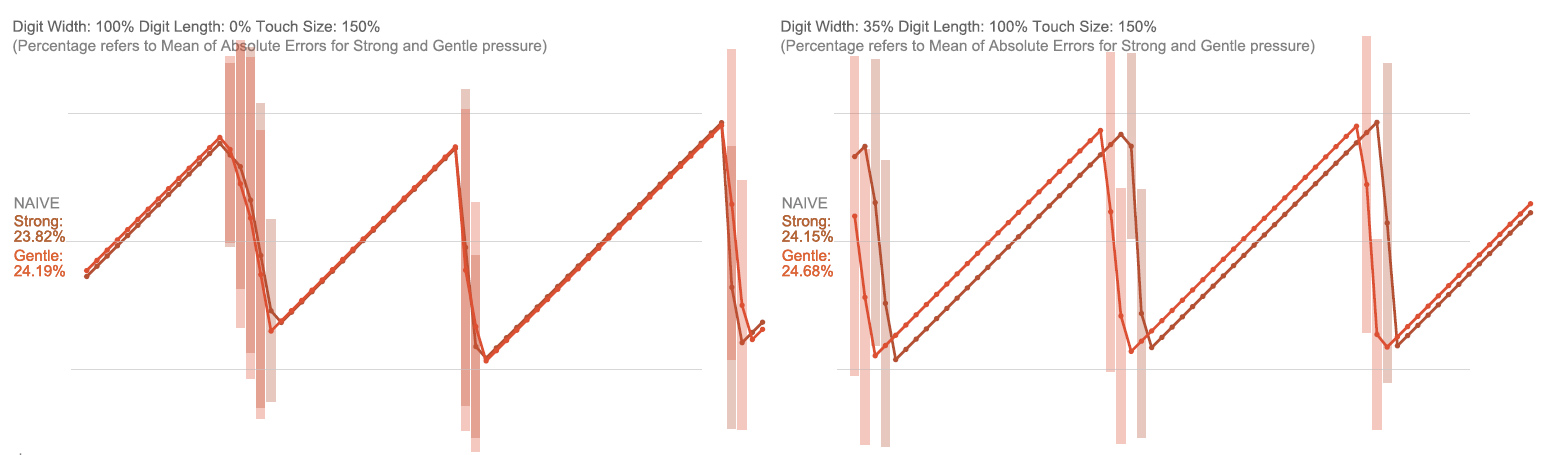
Naive
We added a ‘naive’ approach as reference. This algorithm places the position of the finger at the centre of the electrode with the strongest response. It is somewhat of a ‘worst case’ scenario.